
The amount of information included in your You Need A Cash Plan charts is controlled by changing the number of months shown in your cash plan spreadsheet.
All of the bar and pie charts can be printed and copied to the clipboard.
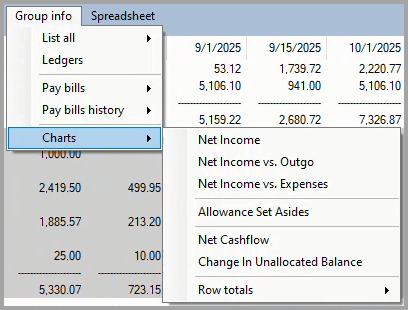
All of the cash plan charts can be displayed by clicking on the Group info menu, hovering over Charts, and clicking on a chart name.
Select bar charts (indicated below by an *) can also be displayed by right-clicking on the corresponding row in your cash plan.
The bar charts can be displayed at any time.
The Row totals charts are available only when the Row Total and Percent columns are shown in your cash plan spreadsheet.